Run of Show Dashboard
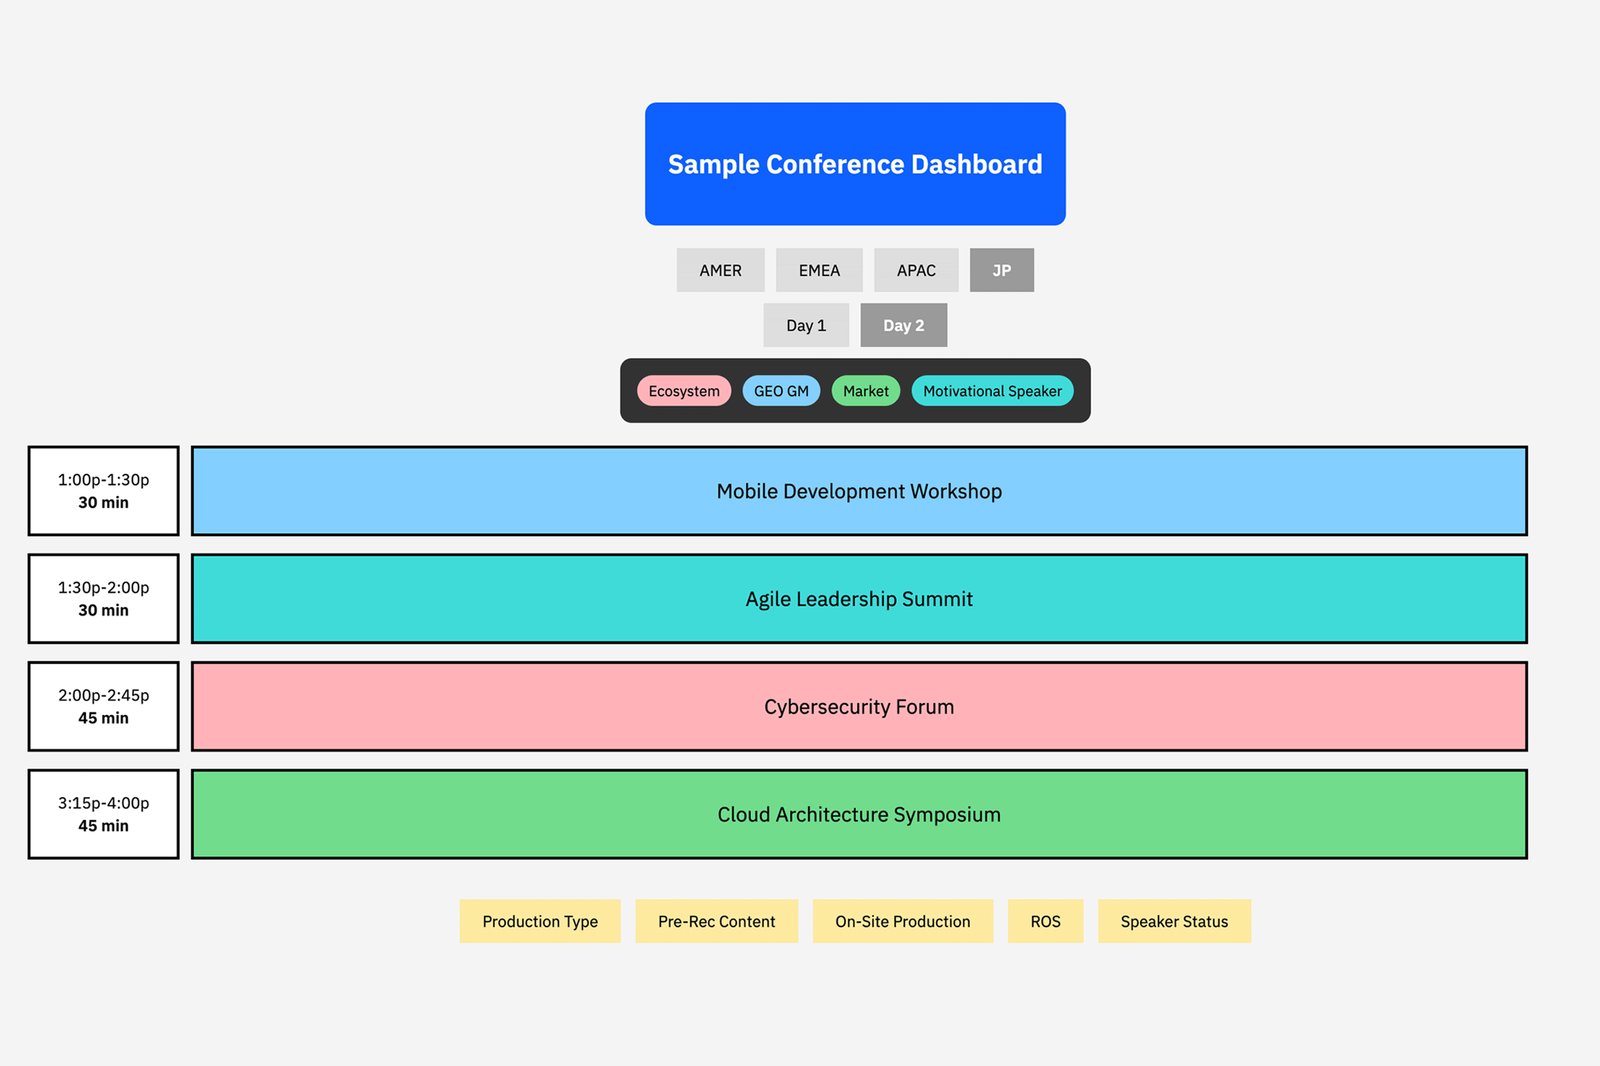
An interactive agenda of each session of a conference or show, with high-level color-coded status views (like a status of a pre-recorded video edit, whether content has been approved, etc.). When a session is clicked, it displays key info (ex. speaker names, session location), for stakeholders like executive producers and clients to address issues quickly or confidently see that every workstream is on track.
Case Study
Challenge
Stakeholders needed a simple way to see the key statuses of conference sessions, without constant context switching between a bunch of unfamiliar platforms.
Solution
Built an integrated dashboard, pulling data from multiple sources with color-coded status indicators, links to latest edited videos, etc.
Results
Created reliable, simplified place for stakeholders to stay up to date without checking multiple sources or being bogged down by excess information.
Implementation
Created responsive web interface with real-time synchronization and direct record linking.
Impact
Surfaced any problems quickly and easily, and provided confidence to clients and executive producers about the status of the conference.